XR Bristol Accessibility and Inclusivity Survey Results
June 30, 2021


In Extinction Rebellion Bristol, we recognise that Extinction Rebellion is not inclusive enough of people from marginalised communities, including working class people, people of colour and disabled people. Not only are people from these communities underrepresented in Extinction Rebellion, but this leads to decision-making that only serves the needs and viewpoints of the privileged, which risks Extinction Rebellion perpetuating structural injustices and failing to achieve the change we seek. Dr Nafeez Ahmed discusses these issues in his 2019 article ‘The Flawed Science Behind Extinction Rebellion’s Change Strategy’ (resilience.org/stories/2019-10-31/the-flawed-social-science-behind-extinction-rebellions-change-strategy).
We agree that this is unacceptable. The climate and ecological crisis threatens the future of life on earth. We will not be able to call for change and implement solutions to the crisis unless people from all sections of society, including those whose voices are often silenced, are engaged and able to contribute. We therefore formed the XR Bristol Inclusivity Working Group to look at the reasons why our group is not inclusive enough, and ways we can become more inclusive, accessible and diverse.
To help us better identify how bad the exclusion in XR Bristol is and the problems causing it, in December 2020 the Inclusivity Working Group created and distributed a survey about inclusivity in XR. We encouraged members of XR Bristol to fill it in, but we also wanted to gather responses from former XR members and people who’ve never been part of the group. To do so, we asked fellow members of the Bristol Movement of Movements of environmental and social groups to share it with their members, and posted it on Bristol Facebook groups about the environment asking people to fill it in. In the interests of transparency, we are now sharing the survey results and information about the actions we are taking in response.
More information about the Inclusivity Working Group is available here: xrbristol.org.uk/working-groups/inclusivity.
The results
We received 77 responses from the survey. There was some useful qualitative data with many people sharing their views and personal experiences. However, the survey has some limitations. Firstly, 45 of the 77 people had volunteered at some point with XR and this was reflected in the demographic and possibly skewed the comments in favour of XR. As Figure 1 shows 2 individuals stood against XR and 5 had tried to volunteer but found it unwelcoming or confusing. Ideally, we would have liked to reach more people who had more of a range of views about XR but there were still some great insights.

Figure 1: Bar graph showing how respondents described their level of interaction with XR.
Description: The results are listed from most to least popular answers. 22 respondents were ‘committed members’.17 respondents were ‘occasional volunteers’.16 respondents selected ‘supports XR, but never volunteered’. 9 respondents ‘used to volunteer, but no longer’. 6 respondents ‘have never engaged with XR’. 5 respondents had ‘tried to volunteer but found XR unwelcoming or confusing’. 2 respondents ‘stood against XR’.

Figure 2: Bar graph showing how respondents answered the question ‘How have you experienced XR?’ This question allowed respondents to choose multiple answers.
Description: The results are listed from most to least popular answers. ‘The News’ was selected 54 times. ‘Social media’ was selected 53 times.‘Encountering a protest’ was selected 48 times. ‘Volunteering with XR’ was selected 45 times. ‘Meeting XR members’ was selected 39 times. ‘Posters/Art in the street’ was selected 37 times. Family/Friends’ was selected 29 times.
The demographics of the respondents mirrored XR’s demographic, which was unsurprising given that 45 respondents had volunteered at some point with XR (See Figure 2). Respondents were predominantly white, able bodied and not religious. The survey did not ask if people were the same gender they were identified at birth but a couple of people confirmed they were cisgender (the same gender they were assigned at birth). In future surveys we aim to ensure questions around transgender experience are included, this was a limitation of this survey.
As Figure 3 and the long form answers showed the logistical barriers to inclusion were primarily:
- Travelling to meetings, especially when relying on public transport
- Struggling to or not enjoying using Zoom
- Some respondents with children found the commitment hard to juggle with childcare or the meeting times inconvenient
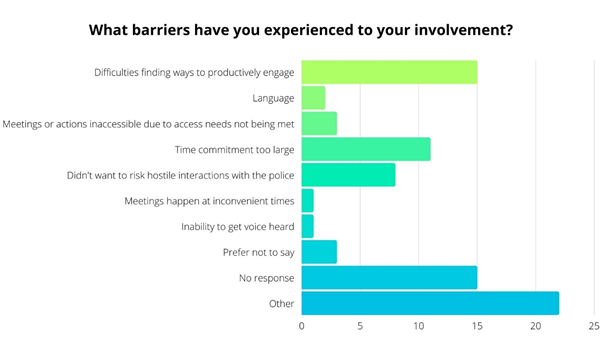
Figure 3: Bar graph showing how respondents answered the question ‘What barriers have you experienced to your involvement?’
Description: The results are listed from most to least popular answers. ‘Other’ was selected by 22 respondents. ‘No response’ by 15. ‘Difficulties finding ways to productively engage’ by 15. ‘Time commitment too large’ by 11. ‘Didn’t want to risk hostile interactions with the police’ by 8. ‘Prefer not to say’ by 3. ‘Meetings or actions inaccessible due to access needs not being met’ by 3. ‘Language’ by 2. ‘Meetings happen at inconvenient times’ by 1. ‘Inability to get voice heard’ by 1.
Although as Figure 3 shows ‘Inability to get voice heard’ did not prevent respondents from attending meetings or events, it was still an issue. 8 people reported having had negative experiences in XR due to their identity group and 2 were uncertain and these were due to their:
- 3 Gender
- 2 Class
- 1 Age
- 1 Disability
- 1 Religion or faith
- 1 Prefer not to say
When it came to mentioning issues of exclusion, comments often did not come from personal experience but rather people’s view of how other groups might feel. This was perhaps due to the selection bias. Figure 4 shows the issues most frequently mentioned by respondents. Class, race and gender were raised by many respondents, reflecting issues that XR and Inclusivity are aware of. For example, XR’s previously collaborative approach to the police was seen by a couple of respondents as failing to acknowledge the discriminatory treatment that minorities often face when dealing with the police.

Figure 4: Word cloud created from long form questions. The size of the word reflects the amount it was mentioned by respondents.
Description: The largest words are ‘class’, ‘confusing’, ‘structure’ and ‘race’. ‘Gender’, ‘age’, ‘childcare’ and ‘police’ are large. ‘Meetings’, ‘communication’, ‘exclusive’ and ‘intimidating’ are in medium sized font. ‘Disability’, ‘cliquey’, ‘overwhelming’ and ‘mental-health’ are in smaller fonts. ‘Vegan’, ‘othered’ and ‘tube’ are in the smallest font.
It is also important to note that one participant felt by the questioning of why ethnic minorities were not better represented in XR ‘othering’. This participant had long been involved in XR and by repeatedly hearing that the organisation was lacking diversity they felt overlooked.
Responses to the questions regarding how people identified themselves and other comments implied some rebels did not believe inclusion was an issue or a priority. However, this was a minority of participants and others commented that they felt welcome but were aware of their own privilege.
Words such as ‘cliquey’ and ‘cult-like’ implied some respondents felt excluded but not necessarily due to their identity groups. There was a suggestion that XR needed to be less insular and engage with other organisations. The confusing structure of XR was cited as a barrier to inclusion or further participation. Similarly, the multitude of communication channels felt overwhelming or inconvenient to several people. There was a sense that it was a lot of work to keep up to date with the ways to get involved or the details of events.
To conclude:
- The visible demographic of XR was seen as alienating to individuals who are not white and middle-class.
- Additionally, XR was not seen as intersectional or engaging in issues outside the priority of the climate crisis.
- A confusing structure and multiple communication methods were a barrier to further involvement for many participants.
Although not emphasised in this report there were also lots of positive comments and many people who had found other rebels friendly and welcoming.
Next Steps
The Inclusivity Working Group have now presented the survey results to the rest of the group in XR Bristol’s Big Bristol Meeting and we discussed ways to improve inclusivity in the group. The Inclusivity Working Group are now developing a toolkit for Working and Affinity groups in XR.
Changes we are currently exploring:
- Providing Inclusivity support from groups and help when dealing with microaggressions
- Having an appointed Inclusion rep within each working group
- having a forum for all new rebels, to smooth entry into XR
- Encourage the uptake of a scale of risk that an individual wants to take rather than just ‘arrestable’ and ‘non-arrestable’
- Promote self-awareness within groups and encourage them to value having a range of life experiences to draw from
Resources about Inclusivity
- Blumberg, A and Dr. Johnson, A. (2020) Black Lives Matter and the Climate. [Podcast] gimletmedia.com/shows/howtosaveaplanet/episodes#show-tab-picker
- Friends of the Earth. (2015) Why Women Will Save the Planet.
- The Havard Implicit bias test: implicit.harvard.edu/implicit/takeatest.html
Appendix
Figure 5: A pie chart displaying that 98% of respondents were very concerned about the climate crisis, 1% was concerned and 1% was not concerned.
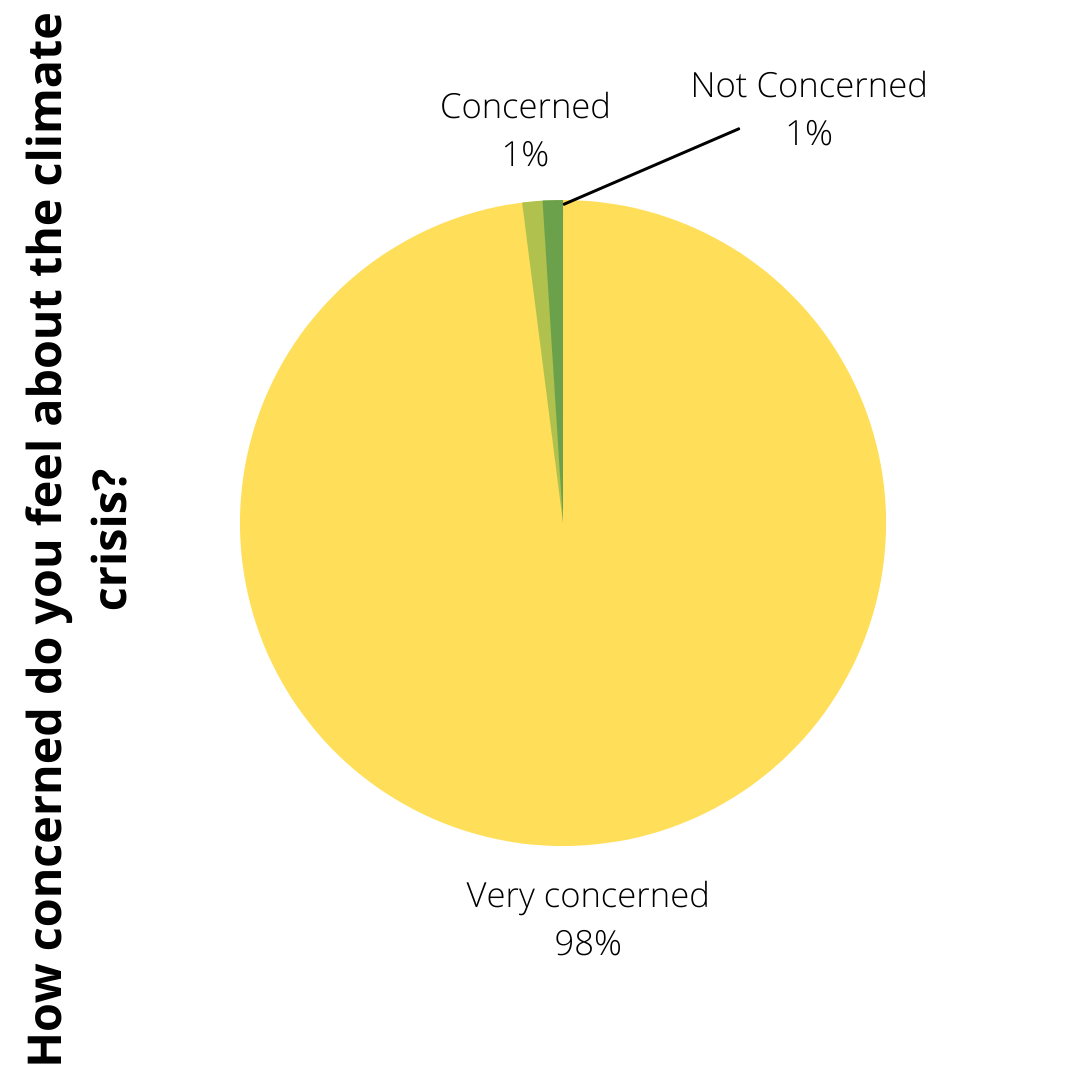
Figure 6: Pie chart displaying the response to ‘How easy was it for you to understand how XR works and how to get involved’? 11% selected very easy. 29% selected easy. 39% selected neither easy or hard. 19% selected difficult. 1% did not respond.
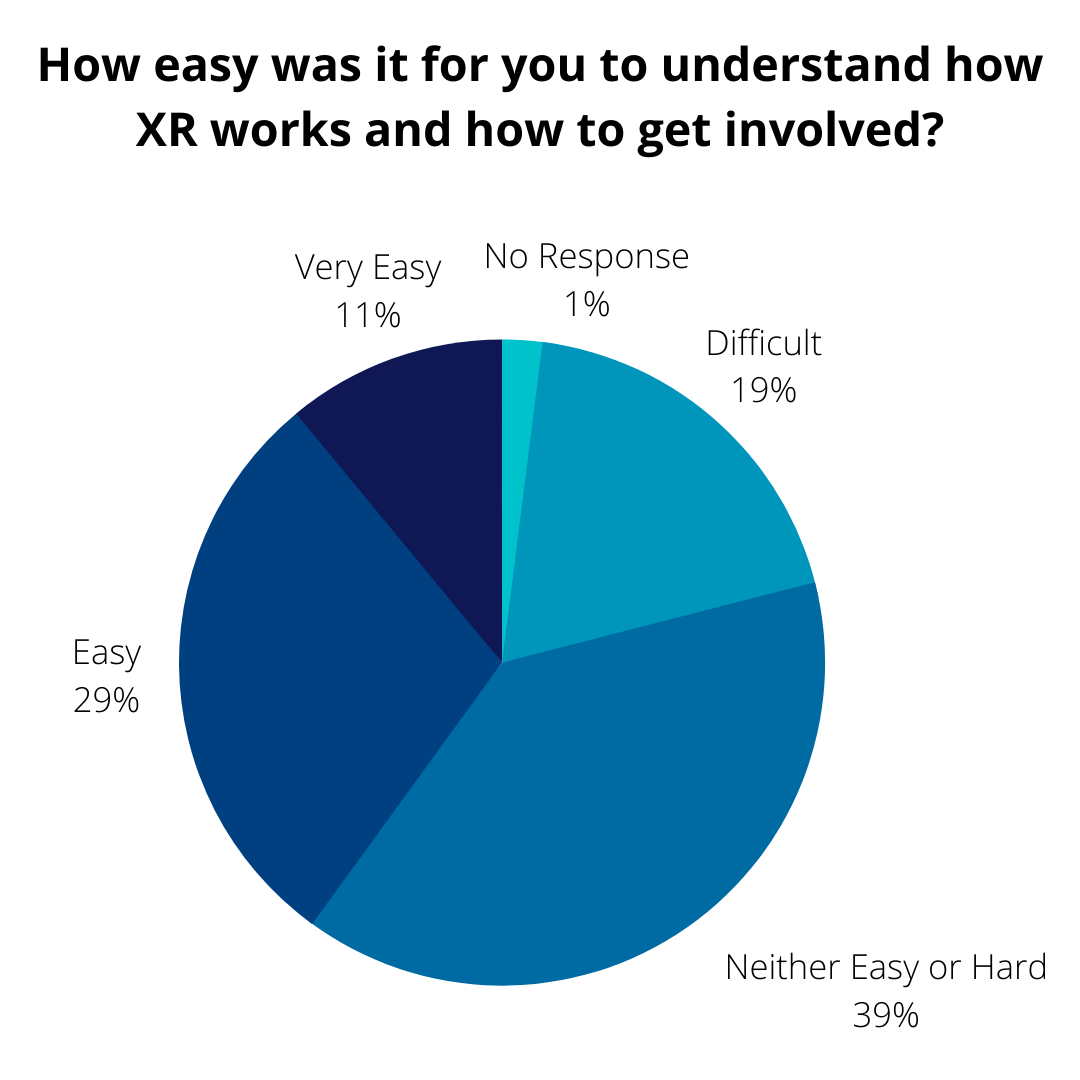
Figure 7: Pie chart displaying the response to ‘How warmly do you feel towards XR?’. 43% of respondents strongly approved of XR. 39% approved. 14% were unsure. 4% disapproved.
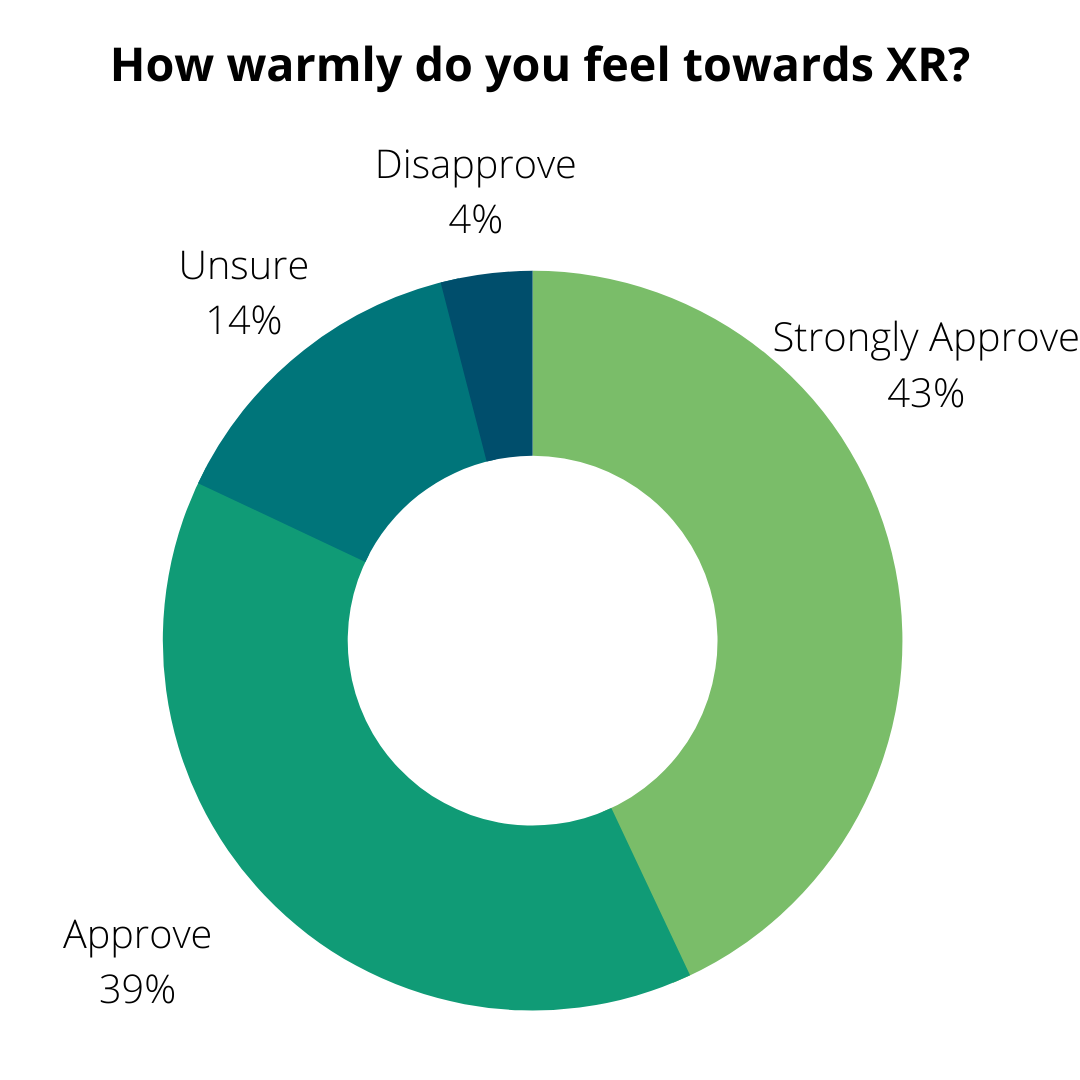
Figure 8: Pie chart displaying the response to ‘How much do you know about XR’? 22% knew lots. 38% knew quite a lot. 26% knew some. 14% knew a bit.
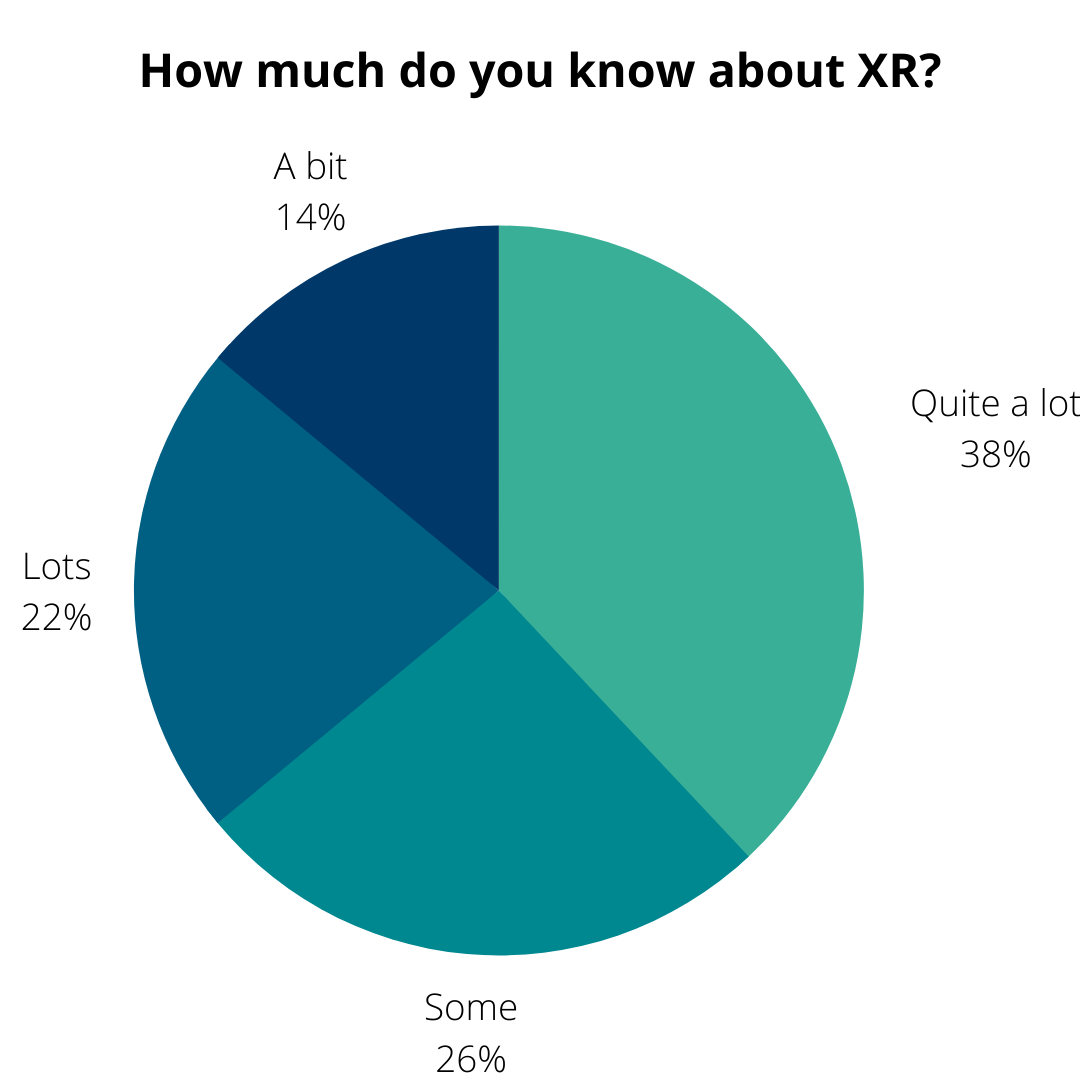
Figure 9: Graph displaying the responses to ‘Have you had any negative experiences in XR due to your identity group’? 61 respondents answered no, 2 were uncertain, 9 responded yes and 5 did not respond.
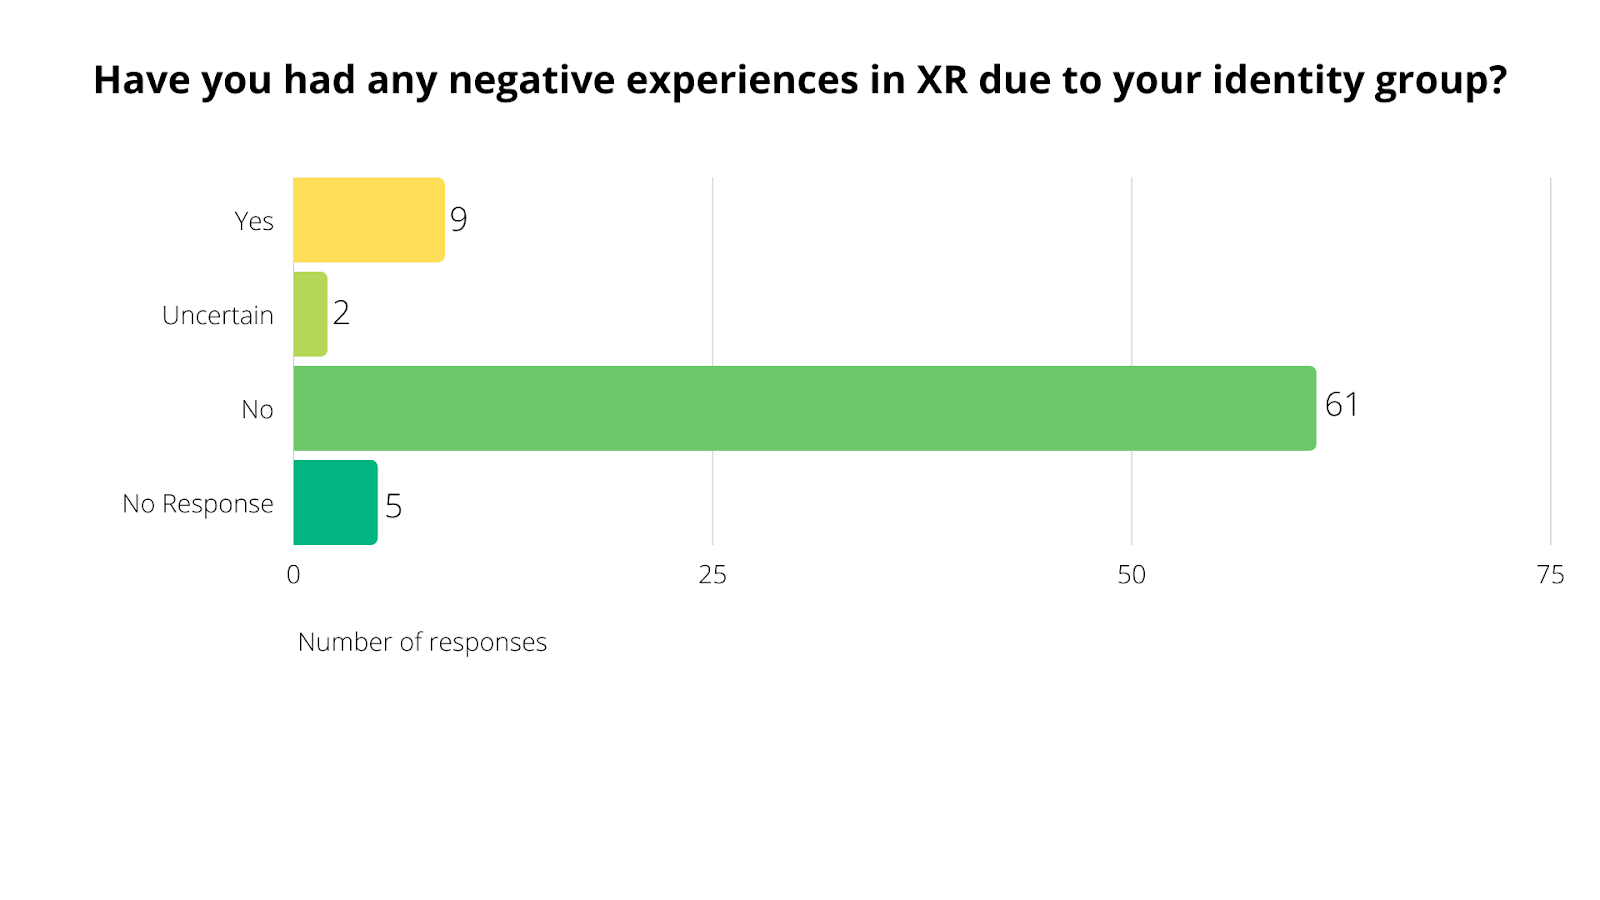
Figure 10: Bar graph displaying the response to ‘What did your negative experience due to your identity group in XR relate to?’ This question allowed multiple selections. Class was selected twice, gender three times, disability twice, age once, religion or faith once, and ‘prefer not to say’ was also selected once.
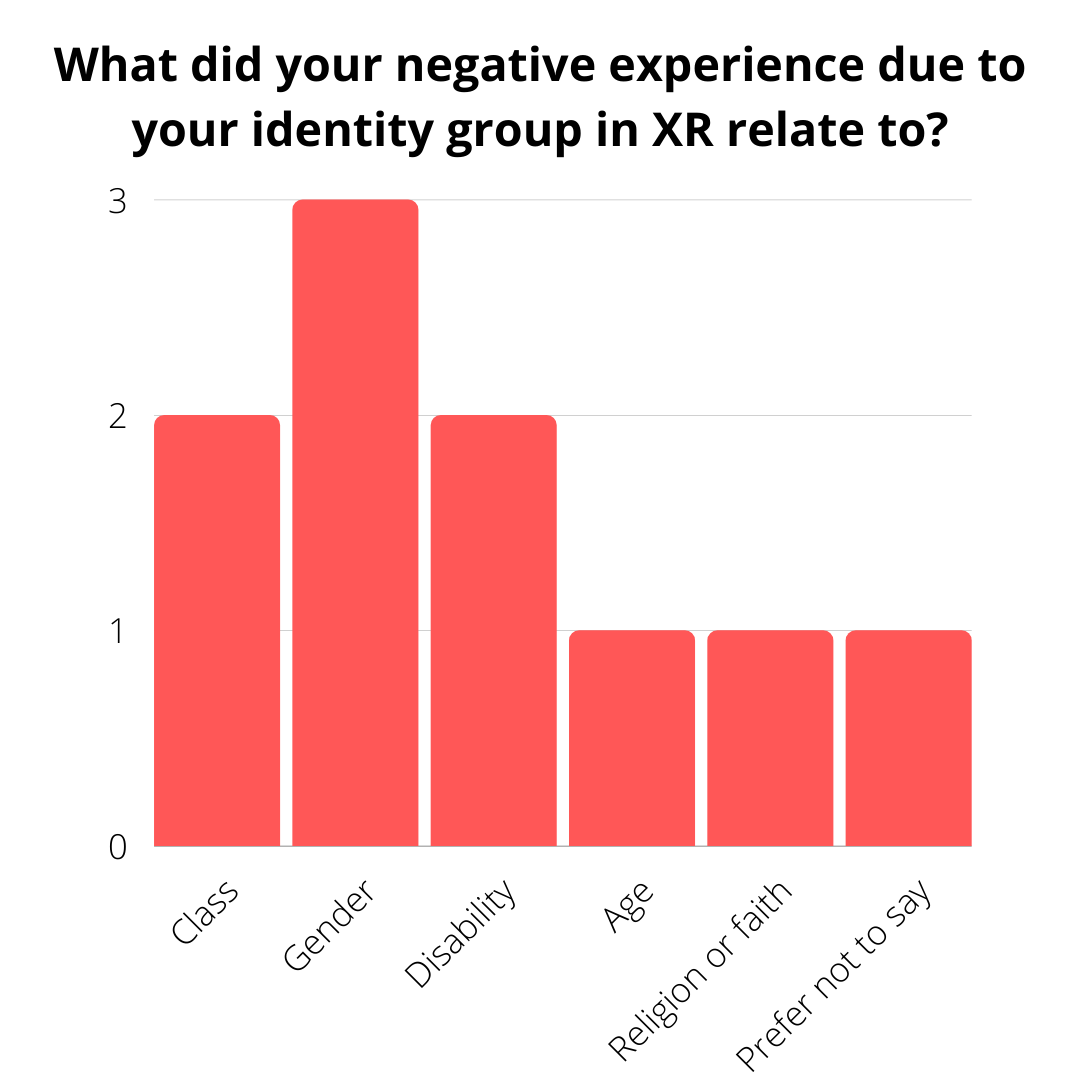
Figure 11: Pie chart displaying the response to ‘do you consider yourself disabled?’. 7 respondents selected yes and 70 selected no.
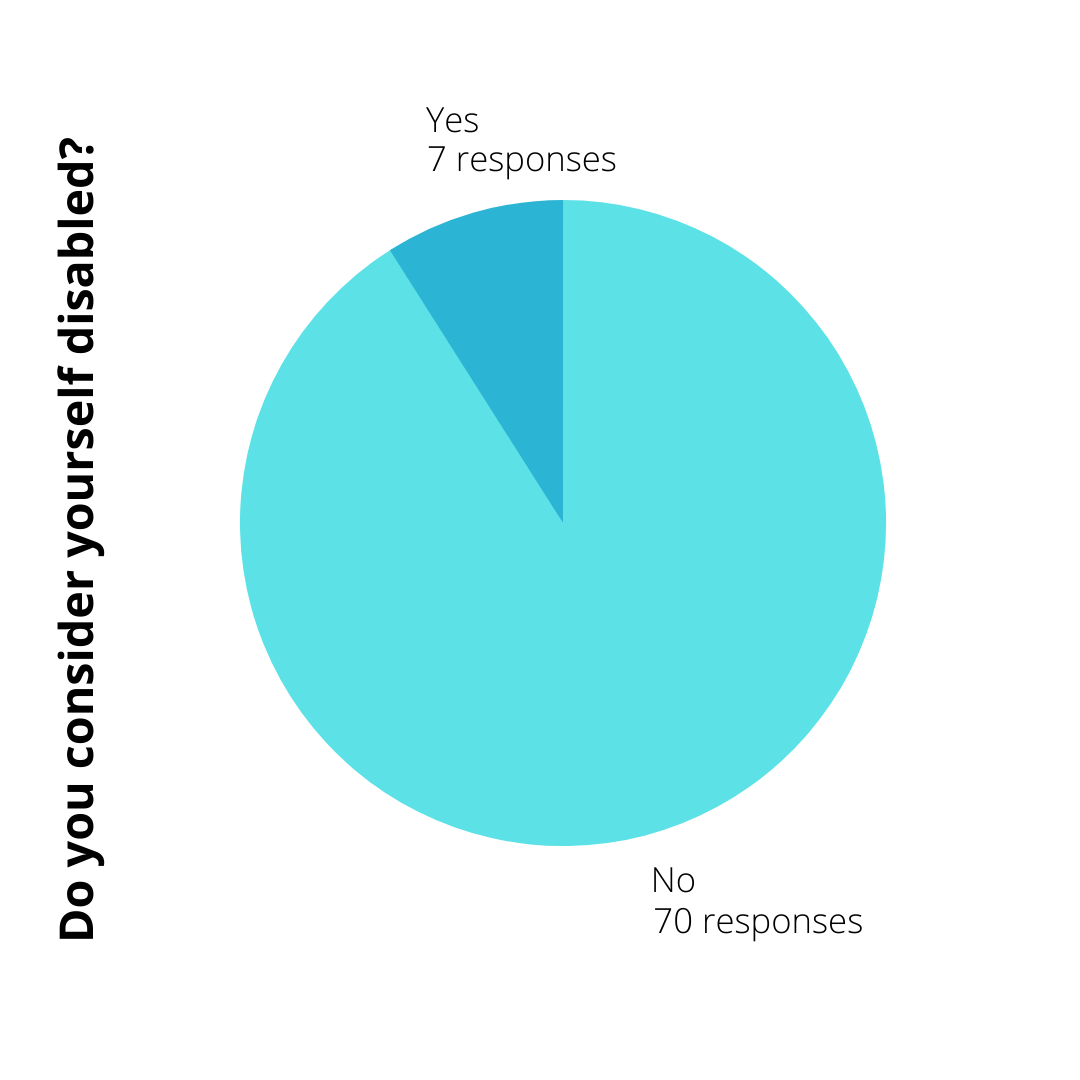
Figure 12: Pie chart displaying the gender of respondents. 47 respondents identified themselves as women and 35 identified as men.
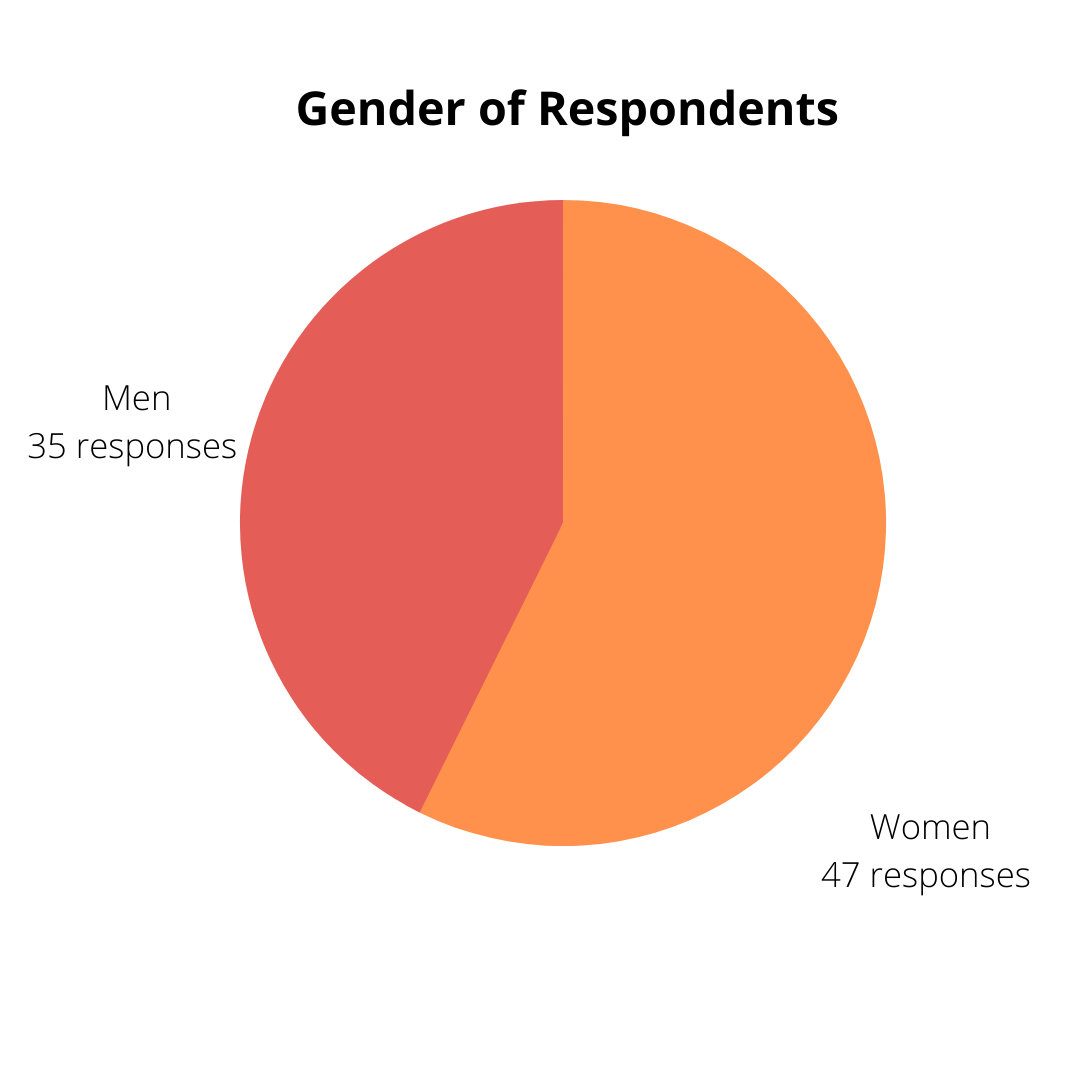
Figure 13: Graph displaying religion of respondents. 43 respondents were not religious, 14 agnostic, 3 Atheist, 7 Christian, 6 Buddhist, 2 Hindu and 1 Jewish.
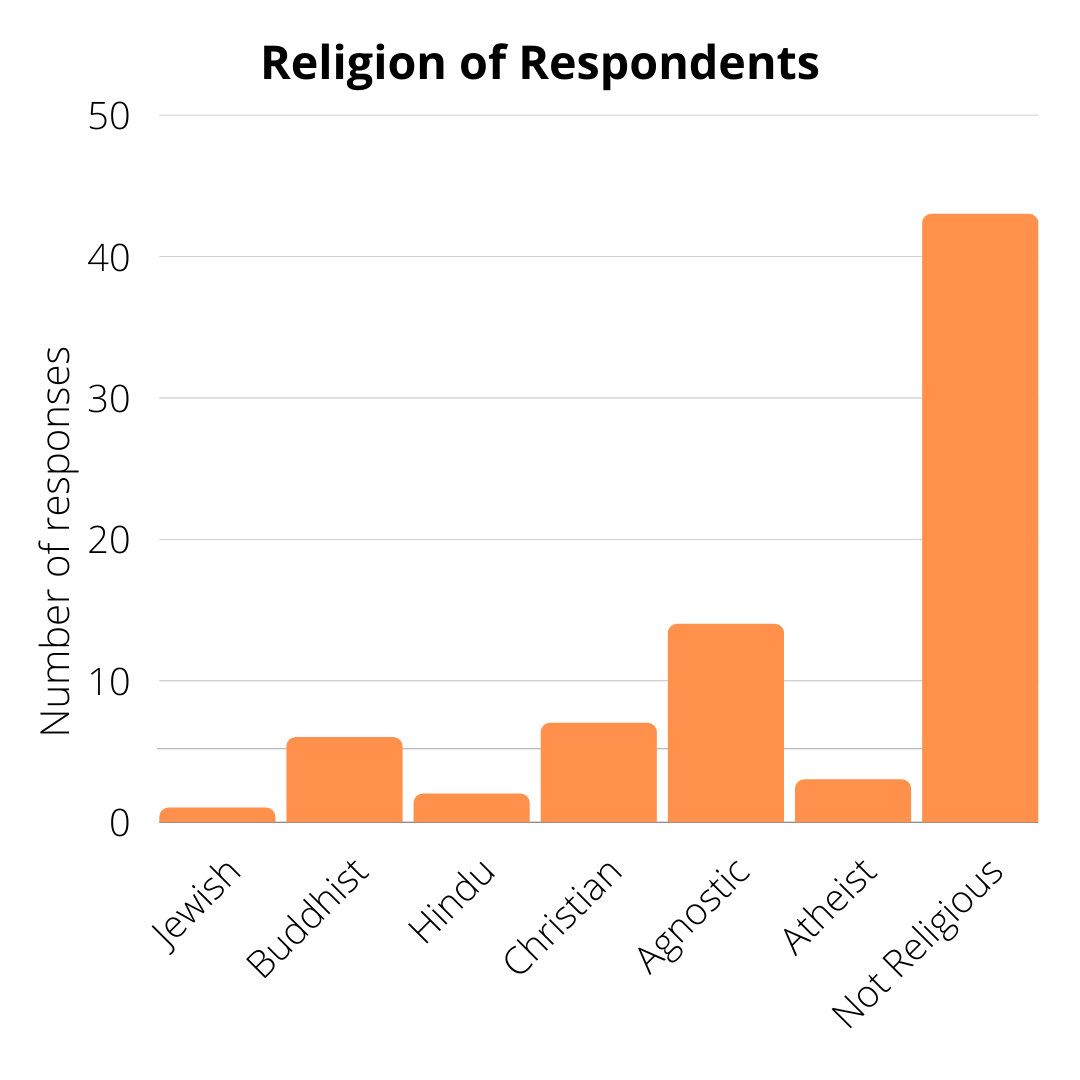
Figure 14: Pie chart displaying sexual orientation of respondents. 44 identified themselves as heterosexual, 10 as bisexual, 1 as asexual, 1 as pansexual and 18 did not respond.
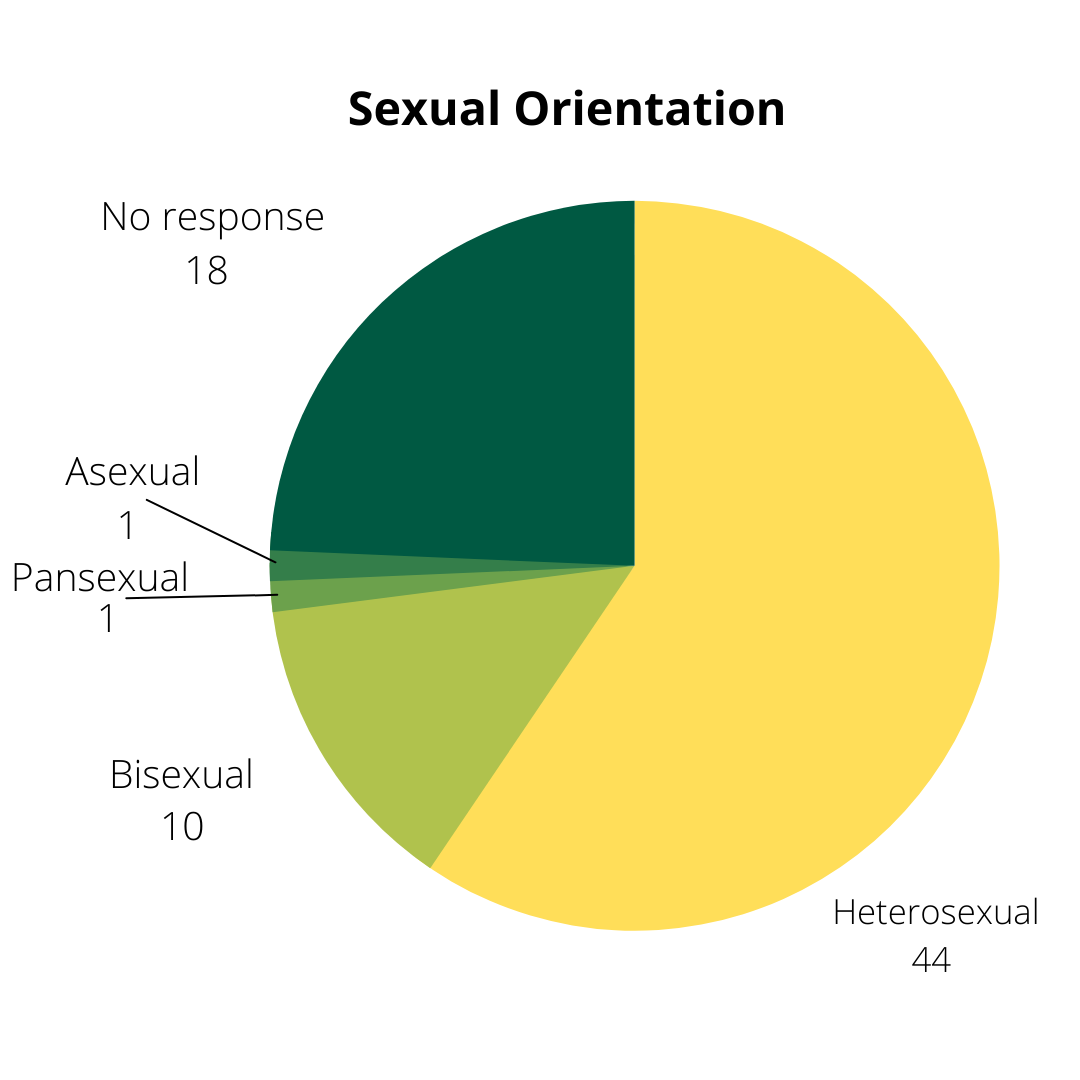
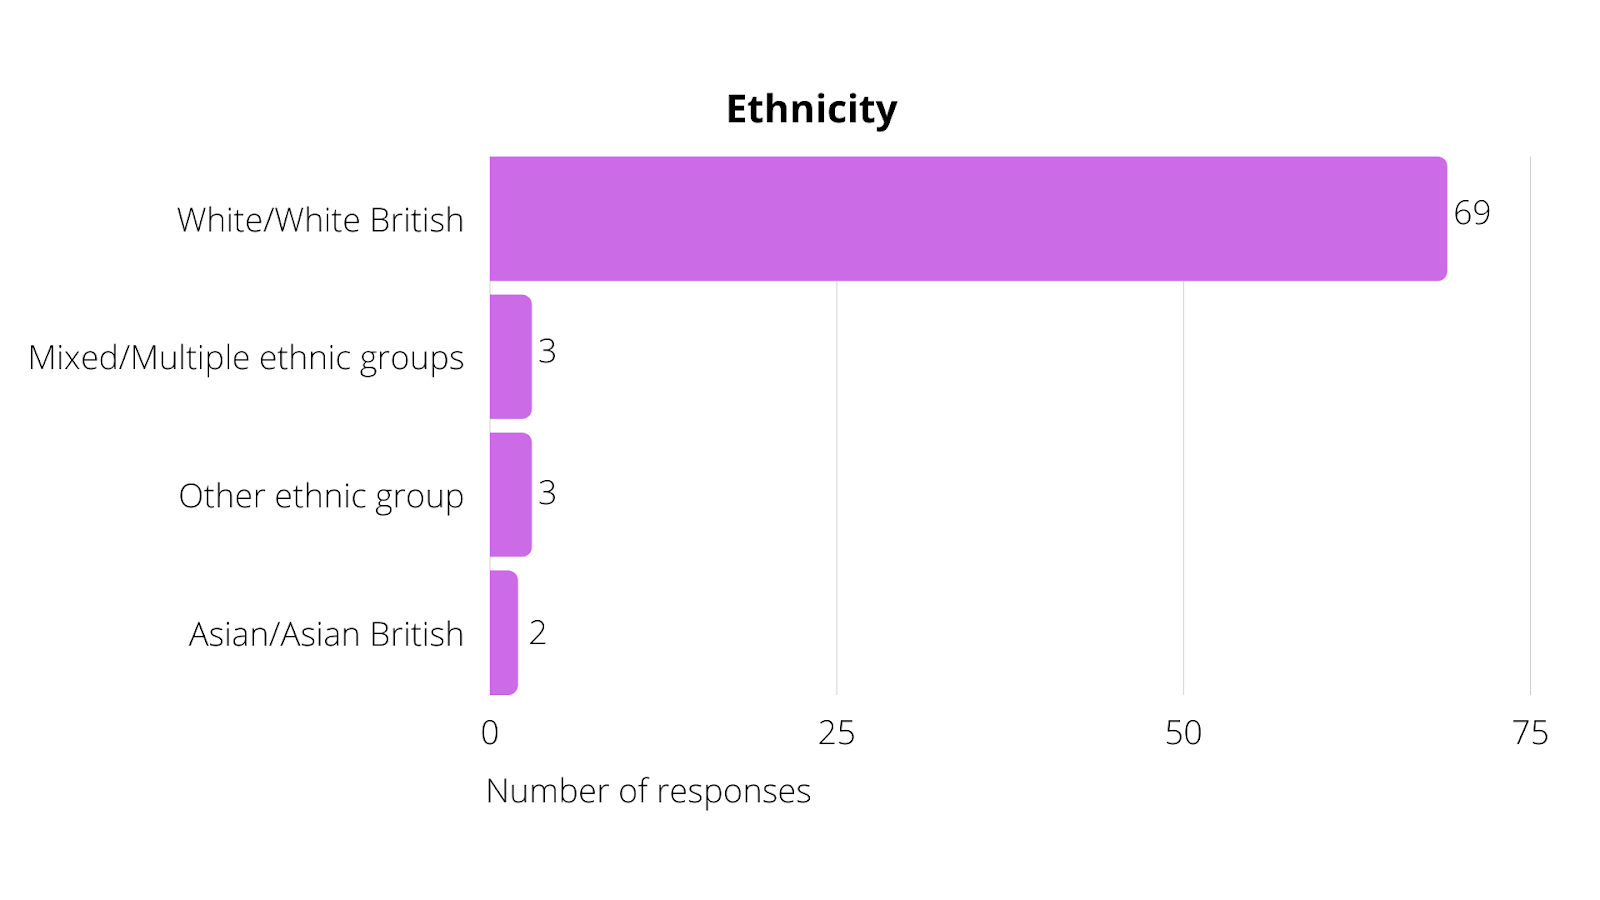
Figure 15: Graph displaying the ethnicity of respondents. 69 selected ‘White/White British’, 3 selected ‘mixed/multiple ethnic groups’, 3 selected other ‘ethnic group’ and 2 selected ‘Asian/Asian British’.